Zhi-Yuan Lee1 and Wei-Ven Chin2 · World Journal of Critical Care Medicine · 9 June 2026 · 15(2):114264
1Department of Medicine and 2Department of Acute Internal Medicine, Sarawak General Hospital, Kuching, Sarawak, Malaysia
Original article and DOI · Download the original PDF
Reproduced under CC BY-NC 4.0 (© Author(s) 2026). Reformatted for the web; source wording retained. This is a proposed protocol, not a validated guideline.
Abstract
Dengue fever is one of the most common mosquito-borne viral diseases and poses a significant health threat. The primary management involves hydration tailored to the disease stage and severity. Although many cases are mild, dengue can rapidly progress within hours. Complications such as plasma leakage and bleeding are difficult to detect through routine clinical assessment alone. In this context, point-of-care ultrasound (POCUS) has emerged as a valuable bedside tool for the early detection of fluid shifts and plasma leakage. Ultrasound findings in dengue-related plasma leakage include gallbladder wall thickening, ascites, pleural effusions, and other third-space fluid shifts. These sonographic signs often precede the clinical presentation of plasma leakage and can serve as early indicators for impending shock. Regular ultrasound assessment facilitates risk stratification and timely intervention, potentially reducing progression to dengue shock syndrome. Currently, there is no validated POCUS protocol specific to dengue assessment. We propose a standardized, structured ultrasound protocol focusing on key diagnostic parameters, coupled with serial serum hematocrit and lactate measurements for a comprehensive evaluation. This approach facilitates earlier identification of at-risk patients, thereby improving patient management, preventing clinical deterioration, and reducing morbidity and mortality associated with severe dengue.
Core tip: This standardized, structured ultrasound protocol focuses on key diagnostic parameters, including gallbladder wall thickness; the presence and extent of ascites, pleural effusion and pericardial effusion; pulmonary interstitial edema; and assessment of fluid responsiveness/tolerance. When integrated with serial serum lactate measurements, it provides a comprehensive framework for clinical evaluation. This approach aims to enable earlier identification of at-risk patients across both general ward and intensive care settings, thereby improving patient care in dengue and reducing morbidity and mortality.
Key words: Dengue fever; Plasma leakage; Point-of-care ultrasound (POCUS); Pulmonary interstitial edema; Ascites; Pleural effusion; Pericardial effusion; Gallbladder wall thickening
Introduction
Dengue fever is one of the most common mosquito-borne viral diseases and poses a significant health threat. It is transmitted by Aedes mosquitoes, primarily Aedes aegypti and Aedes albopictus, which are commonly found in tropical and subtropical regions. Dengue fever is caused by the dengue virus, which has four distinct serotypes-namely DENV-1, DENV-2, DENV-3 and DENV-4[1]-each of which generates a unique host immune response. In 2013, a fifth serotype (DENV-5) was identified in Sarawak, Malaysia, which causes a milder form of disease[2]. Each episode of infection induces lifelong protective immunity to the homologous serotype but confers only partial and transient protection against other serotypes.
Dengue infection is a dynamic disease that manifests across a broad spectrum, ranging from asymptomatic infection to severe dengue. Diagnosis is primarily based on clinical history, supported by hematological and serological testing. According to the World Health Organisation (WHO) 2009 Dengue Classification, severe dengue is defined by the presence of any of the following clinical manifestations: (1) Severe plasma leakage leading to shock or fluid accumulation with respiratory distress; (2) Severe bleeding; and (3) Severe organ impairment, such as hepatitis (elevated transaminases ≥ 1000 IU/L), impaired consciousness, or cardiac involvement[3].
Clinically, dengue infection is divided into three phases (Figure 1), each characterized by distinct clinical manifestations and laboratory changes: Febrile phase, critical/defervescence phase and recovery phase. Febrile phase is marked by the onset of fever, which typically lasts 2-7 days. The other classical signs and symptoms include headache, retroorbital pain, myalgia, arthralgia, and maculopapular rash. This is followed by the critical phase, which begins at defervescence and usually lasts 24-48 hours. It is usually characterized by decreasing platelet count and hemoconcentration, as shown in Figure 1. Severe dengue, as described earlier, often occurs during this phase due to plasma leakage or bleeding. Several indicators of plasma leakage that predict progression to severe dengue-such as pleural effusion, pericardial effusion, ascites, and gallbladder wall thickening-can be detected as early as day 3 of dengue infection, preceding the development of thrombocytopenia and hemoconcentration[3]. As plasma leakage subsides, patients enter into the recovery phase and begin to reabsorb extravasated fluids, which may result in transient systemic congestion.

To date, there is no specific antiviral therapy or vaccine that provides protection against all five DENV serotypes. Management is primarily supportive, with hydration carefully tailored to the stage and severity of the disease.
Although many cases are mild, dengue can progress rapidly within hours. The major cause of morbidity and mortality in dengue fever is plasma leakage. Indeed, the most feared complication of dengue - bleeding, arises from increased vascular permeability. However, both plasma leakage and bleeding are difficult to detect using routine clinical assessment alone. To date, the WHO has suggested that a rapid decline in platelet count accompanied with a rising hematocrit level can be used as a guide to determine the onset of plasma leakage[4]. Nevertheless, interpretation of hematocrit values may be confounded by situations such as concomitant bleeding, unknown baseline hematocrit level, accompanying gastrointestinal losses and hemodilution.
In this context, several studies have demonstrated that individual warning signs listed in the WHO guidelines have poor sensitivity and low positive predictive values for predicting severe disease[5,6]. Clinical examination and laboratory findings suggestive of severe dengue often lag behind ultrasonography findings[7]. Consequently, point-of-care ultrasound (POCUS) has emerged as a valuable bedside tool for clinicians in the evaluation and prognostication of patients with dengue[8,9], enabling early detection of fluid shifts and plasma leakage and guiding hydration therapy[10]. This advantage stems from the higher sensitivity of ultrasonography in detecting early pleural effusion, pericardial effusion and ascites. In conventional anteroposterior chest radiography, pleural effusion is typically detectable only when fluid volume exceeds approximately 200 mL, whereas point-of-care ultrasonography can identify as little as 5-50 mL of fluid with near 100% sensitivity[11]. In addition, ultrasonography avoids exposure to ionizing radiation[12], an advantage that is particularly relevant in settings where laboratory results may not be available in a timely manner.
Currently, there is no validated POCUS protocol specific to dengue assessment. This review focuses on the POCUS techniques and sonographic findings relevant to the different phases of dengue infection.
The dengue assessment POCUS protocol
Ultrasonographic evidence of pleural effusion, pulmonary interstitial edema, ascites, pericholecystic fluid, and gallbladder wall thickening is highly suggestive of plasma leakage, particularly during the critical phase of dengue infection. Besides that, POCUS plays an important role in identifying both fluid responsiveness and fluid intolerance. Assessment of fluid responsiveness has long been advocated in fluid management to determine whether further fluid resuscitation will lead to improvement in cardiac output and organ perfusion; whereas the concept of fluid intolerance has gained increasing attention, as venous congestion with subsequent impairment of end-organ perfusion is associated with poorer clinical outcomes among critically ill patients, especially those with severe dengue. Therefore, integrating the concepts of both fluid responsiveness and fluid tolerance should be considered the standard of care for optimizing individualized fluid management[13]. In the subsequent section, we will emphasize the technical aspects and interpretation of the relevant ultrasonographic features.
Overview: five steps
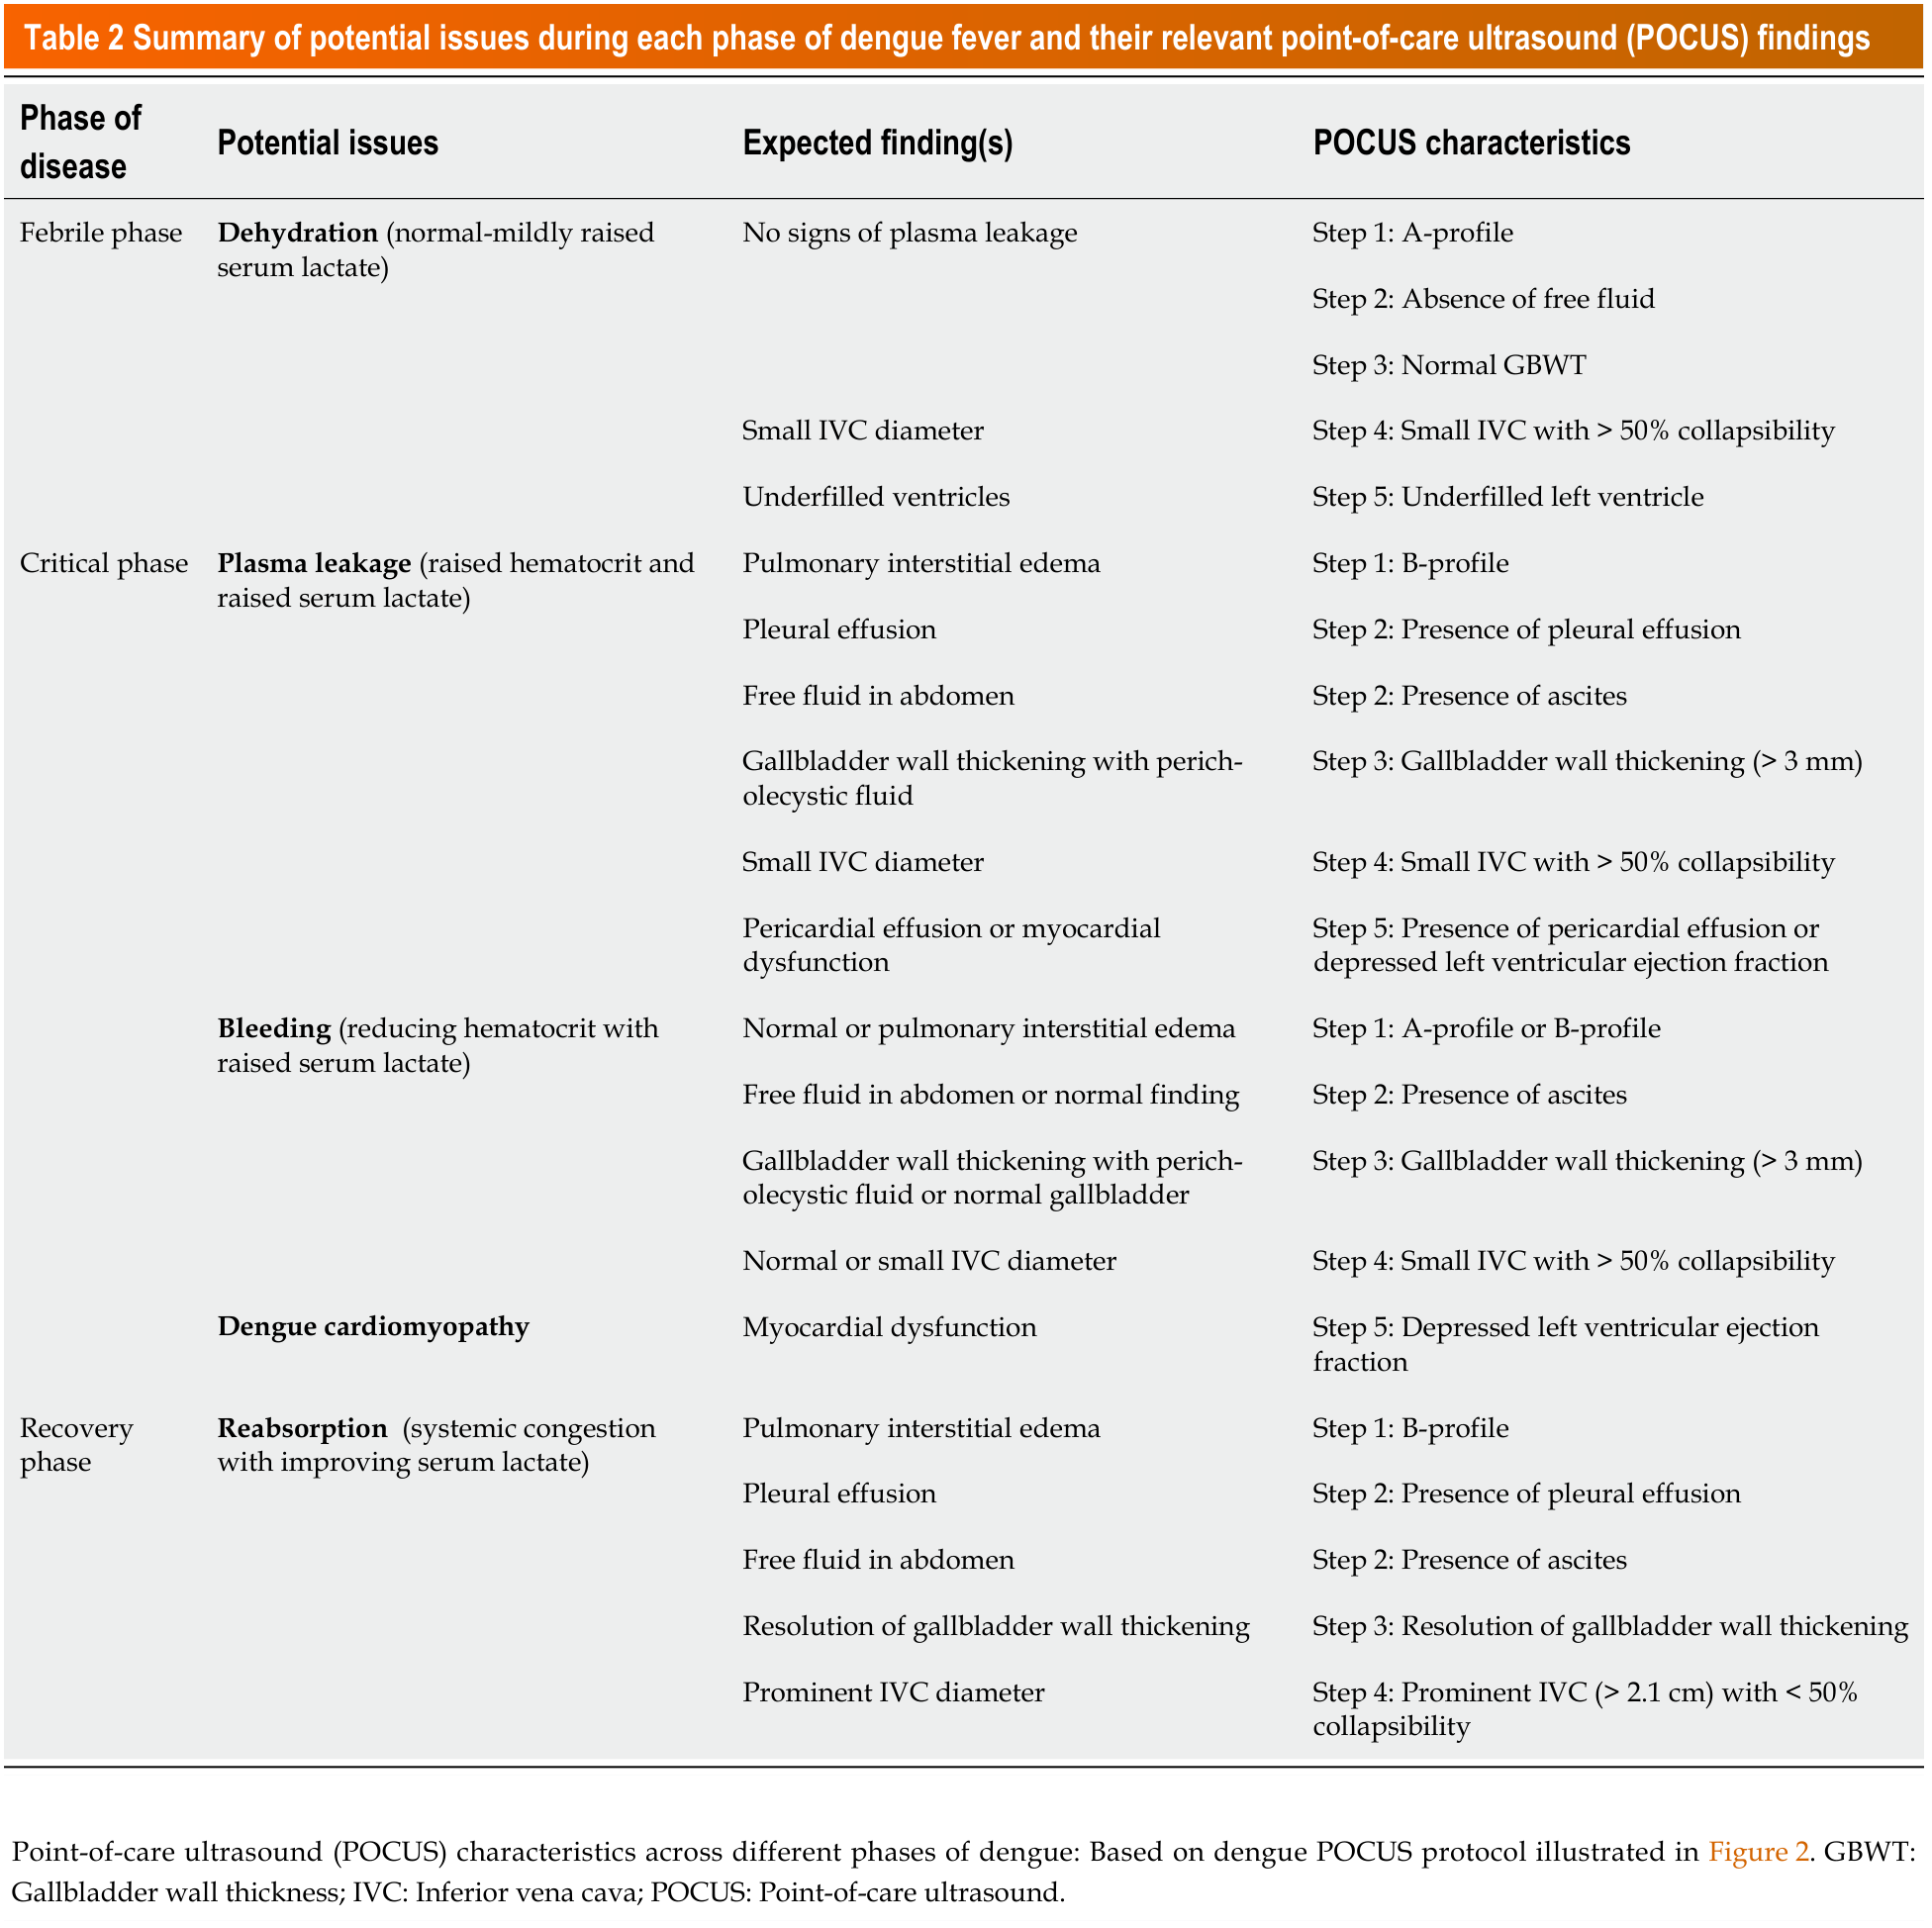
This dengue assessment POCUS protocol focuses on two major components: Detection of plasma leakage and assessment of fluid responsiveness and tolerance. It comprises five key steps, with steps 1 to 3 focusing on identifying signs of plasma leakage, while steps 4 and 5 emphasize detailed assessment of fluid responsiveness and fluid intolerance (Figure 2).
- Steps 1–3 – signs of plasma leakage: lung scan, upper-quadrant free fluid, gallbladder.
- Steps 4–5 – fluid responsiveness and intolerance: IVC and focused cardiac assessment.

Part A: Signs of plasma leakage
Step 1: Lung scan for pulmonary interstitial edema
Lung ultrasound findings are based on the principle of acoustic impedance[14,15], which reflects the resistance of particles within a medium to mechanical vibrations. Acoustic impedance increases in proportion to both the density of the medium and the velocity of ultrasound propagation within it. Air has a very low acoustic impedance; therefore, when ultrasound traverses from soft tissue to air, the large acoustic impedance mismatch results in 99% of the ultrasound being reflected. This produces reverberation artifacts that appear as a series of equally spaced horizontal lines, known as A-lines (Figure 3A), which are characteristics of normally aerated lungs.
In dengue, abnormal lung ultrasound findings of interest include interstitial edema and pleural effusion[16]. The presence of these findings is indicative of plasma leakage.
In this protocol, step 1 is performed using a curvilinear probe (2-5 MHz), placed sequentially at the L1, L2, R1, and R2 regions, as illustrated in Figure 2. An increase in the density of the underlying lung, caused by displacement of air by transudate and exudate - as occurs during plasma leakage and bleeding in the critical phase of dengue fever - reduces the acoustic impedance mismatch between the pleura and the underlying lung structures. These alterations create an acoustic trap, resulting in repeated back-and-forth reflection of the ultrasound beam between the lung and the transducer, thereby producing characteristic comet-tail artifacts (Figure 3B)[17,18]. B-lines, also known as ultrasound lung comets, are discrete vertical reverberation artifacts that originate from the pleural line, extending to the bottom of the image without loss of intensity, and move synchronously with lung sliding. A defining feature of B-lines is their ability to obscure A-lines. Plasma leakage into the pulmonary interstitium during critical phase may manifest as B-lines on lung ultrasound[19]. This B-line reverberation artifact can be graded objectively using lung ultrasound score (LUS) which comprises of score 0, 1, 2, and 3[20,21]. Figure 4 illustrates the detailed criteria for LUS grading.


Step 2: Free fluid in the right and left upper quadrants (R4, RUQ, L4, LUQ)
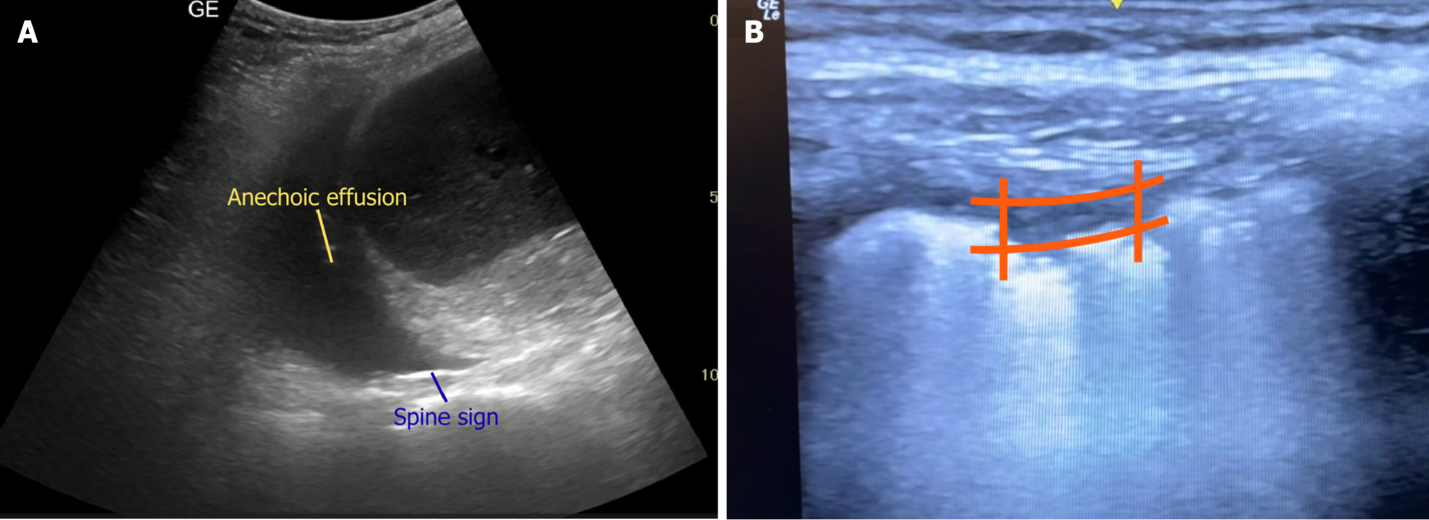
Step 2 involves identification of free fluid in pleural cavities (R4 and L4); tip of the liver, perihepatic region and hepatorenal space in the right upper quadrant (RUQ); perisplenic and splenorenal space in the left upper quadrant (LUQ); and perinephric region, using a curvilinear probe (3-5 MHz) as illustrated in Figure 2. The liver and spleen provide excellent acoustic windows for the detection of pleural effusion. Pleural effusion appears as a dark or anechoic collection in the costophrenic recess above the diaphragm (Figure 5A) or near the chest wall, with appearance of “quad sign” (Figure 5B). The quad sign refers to the typical boundaries defining a pleural effusion, with the vertical boundaries formed by the two anechoic posterior rib shadows and the horizontal boundaries defined by the parietal pleura and the visceral pleura, with the latter being indistinguishable from the adjacent parenchyma, commonly referred to as the “lung line”[22]. Similarly, the presence of “spine sign” (Figure 5A) and “sinusoid sign” serves as indirect indicators of pleural effusion[23]. Under normal conditions, the spine does not extend beyond the diaphragm on ultrasonography because the lung “curtains” over it during expiration. However, the presence of fluid in the pleural space results in posterior acoustic enhancement, leading to the appearance of “spine sign” above the diaphragm[24,25]. Conversely, the presence of “curtain sign” together with a mirror artifact (Figure 6) allows the clinician to confidently exclude pleural effusion[26].

The next focus in step 2 will be identification of free fluid in RUQ and LUQ. Clinical detection of plasma leakage through physical examination for ascites is challenging as a substantial volume of fluid must accumulate before reliable detection is possible. On ultrasonography, ascites appears as a dark or anechoic space, bounded superficially by the abdominal wall and by the bright or hyperechoic peritoneum[27]. Ascites typically accumulates first in the dependant portions of the abdominal cavity, particularly the hepatorenal or splenorenal pouch and the pelvic cavity (Figure 7). When assessing for fluid accumulation, particular attention should be directed to the tip of the liver, as this is often the earliest site where even minimal amounts of fluid become detectable. Other abdominal ultrasonographic features associated with severe dengue include perinephric fluid, hepatomegaly and splenomegaly[28,29].

Step 3: Gallbladder assessment
A curvilinear probe (3-5 MHz) is placed horizontally in the right subcostal region or along the right anterior axillary line, as illustrated in step 3 of Figure 2. Gallbladder wall thickening with associated pericholecystic fluid is a sensitive ultrasonographic finding of severe dengue[30]. The anterior gallbladder wall is used for measurement of the gallbladder wall thickness (GBWT) (Figure 8A)[31]. This is because bile, being liquid in nature, produces posterior acoustic enhancement, which may cause the posterior wall to appear falsely thickened. Various GBWT cutoff values have been proposed, with 3 mm being the most commonly used threshold in a large number of studies[8]. Four distinct patterns of gallbladder wall thickening have been described: Uniform echogenic pattern, striated or tram track pattern, asymmetric pattern and honeycombing pattern[30]. Gallbladder wall thickening (Figure 8B) often precedes the detection of ascites or pleural effusion by 1-3 days[32], with clinical improvement typically coinciding with resolution of the gallbladder wall thickening[28]. Accordingly, ultrasound-detected gallbladder wall thickening and its associated patterns have been suggested as potential indicators of disease severity[33-35].

Part B: Fluid responsiveness and fluid intolerance
Step 4: Inferior vena cava assessment
The inferior vena cava (IVC) is identified using either a curvilinear (2-5 MHz) or phased array probe (3-8 MHz), placed in the subcostal region, or in the right lateral subcostal region at the mid-axillary line in cases of challenging body habitus (Figure 2). The optimal location for IVC size measurement is 3-5 cm from the inferior cavoatrial junction or 1 cm from the junction where the hepatic vein drains into the IVC. The anteroposterior internal diameter measurement is measured either in the longitudinal or transverse axis during inspiration and expiration (Figures 9 and 10) using either B-mode or M-mode imaging[36]. IVC diameter and collapsibility (caval index) have traditionally been identified as non-invasive surrogates for central venous pressure or right atrial pressure (RAP) and to guide fluid responsiveness[37,38]. An IVC diameter ≤ 2.1 cm and collapsibility > 50% during inspiration suggest a RAP of 0-5 mm Hg, whereas a diameter > 2.1 cm with < 50% inspiratory collapse indicates a high RAP of 10-20 mmHg. If both the IVC diameter and caval index do not follow these patterns, a mean RAP value of 8 mmHg (range 5-10 mmHg) may be assumed (Table 1). In mechanically ventilated patient, the distensibility index, calculated as (maximum diameter on inspiration - minimum diameter on expiration)/minimum diameter on expiration, is utilized instead[39,40]. Generally, IVC ≤ 2.1 cm with caval index more than 50% (non mechanically ventilated) or distensibility index more than 18% (mechanically ventilated) indicates fluid responsiveness. Conversely, a prominent IVC with diameter > 2.1 cm with a caval index less than 50% or a distensibility index less than 18% may indicate elevated RAP, suggesting fluid intolerance.


Step 5: Cardiac assessment
In step 5, echocardiography is performed using a phased-array probe (3-8 MHz). Two major views are utilized: The parasternal views (long and short axis) and the subcostal four-chamber view (Figure 2). Echocardiography can guide clinicians in fluid resuscitation of patients with dengue fever by assessing fluid tolerance. The “4 D’s” concept plays a pivotal role in optimizing fluid management in critically ill patients[41]. The four components include: Drugs (choice of fluid), dosing (amount of fluid), duration (rate of fluid administration) and de-escalation (stepwise reduction of fluid therapy). Assessment of left ventricular systolic function provides essential information to guide the dosing and duration components of the 4 D’s framework. Several echocardiographic methods may be used to evaluate left ventricular systolic function, including visual estimation “eyeballing”, fractional shortening, mitral valve E-point septal separation (EPSS), mitral annular plane systolic excursion (MAPSE) using M-mode, and the Teicholz and Simpson methods derived from two-dimensional echocardiography (Figure 11)[42,43]. In addition, cardiac assessment may aid in the identification of dengue-related cardiomyopathy[44].

This step also includes evaluation for pericardial effusion (Figure 12), which may signify plasma leakage in severe dengue[5].

Table 2 summarizes the key potential clinical issues and their corresponding ultrasonographic findings across the different phases of dengue fever.
Clinical applications
This POCUS protocol aims to support risk stratification and guide individualized hydration in dengue fever according to illness severity. Optimal fluid management requires adjustment of hydration volumes based on both the stage and severity of disease[45]. When combined with serum hematocrit and lactate measurements, ultrasonographic findings allow for more precise fluid titration, thereby reducing the risks of both under- and over-hydration compared with reliance on clinical assessment alone[32,46].
This dengue assessment POCUS protocol provides a standardized approach for managing patients across all phases of the illness and enables early identification of individuals at risk of severe dengue.
Hypotension despite initial fluid resuscitation
A key clinical application of this protocol is the evaluation of patients who present with hypotension despite initial fluid resuscitation[47]. In such situations, the differential diagnoses include: (1) Hypovolemic shock due to dehydration secondary to reduced oral intake; (2) Decompensated shock in severe dengue resulting from plasma leakage or haemorrhage; (3) Cardiogenic shock attributable to dengue-related cardiomyopathy or underlying heart failure; (4) Septic shock due to a superimposed bacterial infection; and (5) Less commonly, obstructive shock arising from complications such as pulmonary embolism.
In this scenario, when used alongside routine laboratory investigations (including white blood cell and platelet trends, hematocrit levels) and serial lactate monitoring, this POCUS protocol enhances diagnostic accuracy and facilitates timely, goal-directed resuscitation[32].
Hypovolemia versus plasma leakage versus bleeding
For instance, if the IVC is small in calibre (step 4) in the absence of ultrasonographic features of plasma leakage (steps 1-3), and this is accompanied by clinical signs of dehydration, a normal or mildly elevated hematocrit, and normal serum lactate, the findings are most consistent with hypovolemia. In such cases, the appropriate management strategy is fluid repletion to restore intravascular volume, typically using crystalloids at rates of up to 5 mL/kg/hour[45,48,49]. Serial POCUS assessments are essential for evaluating therapeutic response and optimizing both the rate and volume of fluid administration, as discussed previously.
Conversely, if the IVC remains small in calibre (step 4) but is accompanied by ultrasonographic evidence of plasma leakage (steps 1-3) such as pulmonary interstitial edema with B-lines on lung ultrasound, intra-abdominal free fluid, and gallbladder wall thickening or edema, together with elevated serum lactate, the clinical picture is more suggestive of significant plasma leakage or bleeding. Differentiating plasma leakage from bleeding can be challenging; however, integration of blood parameters with POCUS findings substantially improves clinical decision-making. In severe plasma leakage, both serum lactate and hematocrit typically rise despite initial fluid resuscitation, along with ultrasonographic evidence of leakage (steps 1-3). Furthermore, these sonographic signs often precede overt clinical manifestations, serving as early indicators of impending shock[28-30,32,33]. In contrast, in occult bleeding, serum lactate is elevated while hematocrit is disproportionately low relative to the degree of shock expected from plasma leakage alone. Management therefore differs accordingly: Severe plasma leakage requires aggressive fluid resuscitation (up to 20 mL/kg/hour) with crystalloids or colloids is indicated[45,48,49], whereas haemorrhage necessitates transfusion of blood or blood products[45,50].
Dengue cardiomyopathy versus plasma leakage
POCUS is also valuable in differentiating dengue-related cardiomyopathy or myocarditis from plasma leakage, as management strategies differ substantially. Both conditions may present with pulmonary interstitial edema (B-profile on lung ultrasound), intraperitoneal free fluid, and gallbladder wall edema. Assessment of the IVC and focused echocardiography (steps 4-5) is critical in these scenarios[51,52]. In dengue cardiomyopathy, the IVC is typically plethoric (large calibre), and left ventricular systolic function may be impaired, distinguishing cardiogenic from distributive or hypovolemic shock. In cases of fluid overload secondary to dengue cardiomyopathy, a judicious decongestion strategy may be required, guided by advanced POCUS techniques such as the venous excess ultrasound (VExUS) score (Figure 13)[53-55]. By contrast, aggressive fluid resuscitation, particularly guided by POCUS, remains crucial in plasma leakage, including in patients with pre-existing cardiac or renal dysfunction[50].

Overlapping pathology
Given the heterogeneity and evolving complexity of dengue manifestations, patients - particularly those with multiple comorbidities - may develop a wide range of complications or overlapping pathological processes, including concurrent plasma leakage and dengue-related cardiomyopathy. Therefore, reliance on a single POCUS parameter or a “one-size-fits-all” strategy is neither appropriate nor clinically meaningful. Management should instead be guided by an integrated assessment incorporating physical examination, dynamic laboratory trends, POCUS findings and astute clinical judgment.
In summary, this POCUS protocol is intended to complement, not replacing comprehensive clinical assessment, thereby supporting informed decision-making in complex clinical presentations.
Table 3 summarises common clinical scenarios in dengue fever, their associated laboratory and ultrasonographical findings and corresponding management strategies[45].

Limitations
Although the dengue assessment POCUS protocol is valuable in assisting clinicians with prognostication and management of dengue, it is not without limitations. Effective implementation necessitates proficiency in both ultrasound image acquisition and interpretation - competencies that often entail a considerable learning curve, especially for junior doctors. Furthermore, variability in patients’ body habitus (e.g. obesity, abdominal distention) may pose additional challenges in acquiring desirable images. Access to ultrasound equipment may also be restricted in some centres.
Conclusion
We suggest the use of a standardized, structured POCUS protocol focusing on key diagnostic parameters, coupled with serial serum lactate measurements for a comprehensive evaluation in managing patients with dengue fever. This approach aims to facilitate earlier identification of at-risk patients, thereby improving patient management, preventing clinical deterioration, and reducing dengue-associated morbidity and mortality.
Article information
Author contributions: Lee ZY designed and drafted the manuscript; Chin WV supervised and revised the manuscript.
Conflict of interest: The authors declare that they have no conflict of interest.
Corresponding author: Zhi-Yuan Lee, MD, MRCP (UK), Department of Medicine, Sarawak General Hospital.
Publication history: Received 15 September 2025 · Revised 25 November 2025 · Accepted 26 January 2026 · Published online 9 June 2026. Externally peer reviewed (single blind). Published by Baishideng Publishing Group Inc.
Cite as: Lee ZY, Chin WV. Integrating structured point-of-care ultrasound into dengue fever management: A mini review and comprehensive clinical guide. World J Crit Care Med 2026; 15(2): 114264. DOI: 10.5492/wjccm.v15.i2.114264
References
- Bäck AT, Lundkvist A. Dengue viruses - an overview. Infect Ecol Epidemiol 2013; 3. PMID: 24003364; DOI: 10.3402/iee.v3i0.19839
- Mustafa MS, Rasotgi V, Jain S, Gupta V. Discovery of fifth serotype of dengue virus (DENV-5): A new public health dilemma in dengue control. Med J Armed Forces India 2015; 71: 67-70. PMID: 25609867; DOI: 10.1016/j.mjafi.2014.09.011
- PoSaw LL, Wubben BM, Bertucci N, Bell GA, Healy H, Lee S. Teaching emergency ultrasound to emergency medicine residents: a scoping review of structured training methods. J Am Coll Emerg Physicians Open 2021; 2: e12439. PMID: 34142104; DOI: 10.1002/emp2.12439
- Dengue: Guidelines for Diagnosis, Treatment, Prevention and Control: New Edition. Geneva: World Health Organization; 2009. PMID: 23762963
- Ishibashi K, Motokawa M, Moniruzzaman M, Ahmed A, Islam S. A Case of Emergency Pericardial Drainage for Cardiac Tamponade Due to Dengue Fever. Cureus 2024; 16: e69712. PMID: 39429321; DOI: 10.7759/cureus.69712
- Leo YS, Gan VC, Ng EL, Hao Y, Ng LC, Pok KY, Dimatatac F, Go CJ, Lye DC. Utility of warning signs in guiding admission and predicting severe disease in adult dengue. BMC Infect Dis 2013; 13: 498. PMID: 24152678; DOI: 10.1186/1471-2334-13-498
- Ahmad MH, Ibrahim MI, Mohamed Z, Ismail N, Abdullah MA, Shueb RH, Shafei MN. The Sensitivity, Specificity and Accuracy of Warning Signs in Predicting Severe Dengue, the Severe Dengue Prevalence and Its Associated Factors. Int J Environ Res Public Health 2018; 15: 2018. PMID: 30223572; DOI: 10.3390/ijerph15092018
- Dewan N, Zuluaga D, Osorio L, Krienke ME, Bakker C, Kirsch J. Ultrasound in Dengue: A Scoping Review. Am J Trop Med Hyg 2021; 104: 826-835. PMID: 33534759; DOI: 10.4269/ajtmh.20-0103
- Balasubramanian S, Janakiraman L, Kumar SS, Muralinath S, Shivbalan S. A reappraisal of the criteria to diagnose plasma leakage in dengue hemorrhagic fever. Indian Pediatr 2006; 43: 334-339. PMID: 16651672
- Xin Tian C, Baharuddin KA, Shaik Farid AW, Andey R, Ridzuan MI, Siti-Azrin AH. Ultrasound findings of plasma leakage as imaging adjunct in clinical management of dengue fever without warning signs. Med J Malaysia 2020; 75: 635-641. PMID: 33219170
- Froudarakis ME. Diagnostic work-up of pleural effusions. Respiration 2008; 75: 4-13. PMID: 18185024; DOI: 10.1159/000112221
- Miller A. Practical approach to lung ultrasound. BJA Education 2016; 16: 39-45. DOI: 10.1093/bjaceaccp/mkv012
- Muñoz F, Born P, Bruna M, Ulloa R, González C, Philp V, Mondaca R, Blanco JP, Valenzuela ED, Retamal J, Miralles F, Wendel-Garcia PD, Ospina-Tascón GA, Castro R, Rola P, Bakker J, Hernández G, Kattan E. Coexistence of a fluid responsive state and venous congestion signals in critically ill patients: a multicenter observational proof-of-concept study. Crit Care 2024; 28: 52. PMID: 38374167; DOI: 10.1186/s13054-024-04834-1
- Lee FC. Lung ultrasound-a primary survey of the acutely dyspneic patient. J Intensive Care 2016; 4: 57. PMID: 27588206; DOI: 10.1186/s40560-016-0180-1
- Sperandeo M, Filabozzi P, Varriale A, Carnevale V, Piattelli ML, Sperandeo G, Brunetti E, Decuzzi M. Role of thoracic ultrasound in the assessment of pleural and pulmonary diseases. J Ultrasound 2008; 11: 39-46. PMID: 23396553; DOI: 10.1016/j.jus.2008.02.001
- Koyama H, Chierakul W, Charunwatthana P, Sanguanwongse N, Phonrat B, Silachamroon U, Dondorp AM. Lung Ultrasound Findings of Patients with Dengue Infection: A Prospective Observational Study. Am J Trop Med Hyg 2021; 105: 766-770. PMID: 34280132; DOI: 10.4269/ajtmh.20-1274
- Vieira JR, Castro MR, Guimarães TP, Pinheiro AJT, Figueiredo ACTC, Martins BJ, Carmo DRD, Oliveira WA. Evaluation of pulmonary B lines by different intensive care physicians using bedside ultrasonography: a reliability study. Rev Bras Ter Intensiva 2019; 31: 354-360. PMID: 31618355; DOI: 10.5935/0103-507X.20190058
- Lichtenstein D, Mezière G, Biderman P, Gepner A. The comet-tail artifact: an ultrasound sign ruling out pneumothorax. Intensive Care Med 1999; 25: 383-388. PMID: 10342512; DOI: 10.1007/s001340050862
- Khoo SMK, Lee CYF. Review of the role of ultrasound in assessing plasma leakage in dengue fever and a proposed scanning protocol. Hong Kong J Emerg Med 2024; 31: 465-471. DOI: 10.1002/hkj2.12062
- Mongodi S, De Luca D, Colombo A, Stella A, Santangelo E, Corradi F, Gargani L, Rovida S, Volpicelli G, Bouhemad B, Mojoli F. Quantitative Lung Ultrasound: Technical Aspects and Clinical Applications. Anesthesiology 2021; 134: 949-965. PMID: 33819339; DOI: 10.1097/ALN.0000000000003757
- Zhao Z, Jiang L, Xi X, Jiang Q, Zhu B, Wang M, Xing J, Zhang D. Prognostic value of extravascular lung water assessed with lung ultrasound score by chest sonography in patients with acute respiratory distress syndrome. BMC Pulm Med 2015; 15: 98. PMID: 26298866; DOI: 10.1186/s12890-015-0091-2
- Bhoil R, Ahluwalia A, Chopra R, Surya M, Bhoil S. Signs and lines in lung ultrasound. J Ultrason 2021; 21: e225-e233. PMID: 34540277; DOI: 10.15557/JoU.2021.0036
- Wong A, Patail H, Ahmad S. The Absent Sinusoid Sign. Ann Am Thorac Soc 2019; 16: 506-508. PMID: 30932704; DOI: 10.1513/AnnalsATS.201810-654CC
- Bediwy AS, Al-Biltagi M, Saeed NK, Bediwy HA, Elbeltagi R. Pleural effusion in critically ill patients and intensive care setting. World J Clin Cases 2023; 11: 989-999. PMID: 36874438; DOI: 10.12998/wjcc.v11.i5.989
- Dickman E, Terentiev V, Likourezos A, Derman A, Haines L. Extension of the Thoracic Spine Sign: A New Sonographic Marker of Pleural Effusion. J Ultrasound Med 2015; 34: 1555-1561. PMID: 26269297; DOI: 10.7863/ultra.15.14.06013
- Lee FCY. The Curtain Sign in Lung Ultrasound. J Med Ultrasound 2017; 25: 101-104. PMID: 30065468; DOI: 10.1016/j.jmu.2017.04.005
- Rudralingam V, Footitt C, Layton B. Ascites matters. Ultrasound 2017; 25: 69-79. PMID: 28567101; DOI: 10.1177/1742271X16680653
- Pothapregada S, Kullu P, Kamalakannan B, Thulasingam M. Is Ultrasound a Useful Tool to Predict Severe Dengue Infection? Indian J Pediatr 2016; 83: 500-504. PMID: 26846603; DOI: 10.1007/s12098-015-2013-y
- Santhosh VR, Patil PG, Srinath MG, Kumar A, Jain A, Archana M. Sonography in the diagnosis and assessment of dengue Fever. J Clin Imaging Sci 2014; 4: 14. PMID: 24744971; DOI: 10.4103/2156-7514.129260
- Parmar JP, Mohan C, Vora M. Patterns of Gall Bladder Wall Thickening in Dengue Fever: A Mirror of the Severity of Disease. Ultrasound Int Open 2017; 3: E76-E81. PMID: 28603785; DOI: 10.1055/s-0043-105262
- Lucius C, Braden B, Jenssen C, Möller K, Sienz M, Zervides C, Essig MW, Dietrich CF. Ultrasound of the Gallbladder-An Update on Measurements, Reference Values, Variants and Frequent Pathologies: A Scoping Review. Life (Basel) 2025; 15: 941. PMID: 40566593; DOI: 10.3390/life15060941
- Michels M, Sumardi U, de Mast Q, Jusuf H, Puspita M, Dewi IM, Sinarta S, Alisjahbana B, van der Ven AJ. The predictive diagnostic value of serial daily bedside ultrasonography for severe dengue in Indonesian adults. PLoS Negl Trop Dis 2013; 7: e2277. PMID: 23785539; DOI: 10.1371/journal.pntd.0002277
- Shahsavand Davoudi A, Harandi H, Samiee R, Forghani S, Mohammadi K, Shafaati M. Ultrasound evaluation of gallbladder wall thickness for predicting severe dengue: a systematic review and meta-analysis. Ultrasound J 2025; 17: 12. PMID: 39899203; DOI: 10.1186/s13089-025-00417-5
- Tavares MA, João GAP, Bastos MS, Gimaque JBL, Almeida ACG, Ngo TT, Bahamon C, Baia-da-Silva DC, Monteiro WM, Mourão MPG, Lacerda MVG. Clinical relevance of gallbladder wall thickening for dengue severity: A cross-sectional study. PLoS One 2019; 14: e0218939. PMID: 31469845; DOI: 10.1371/journal.pone.0218939
- Setiawan MW, Samsi TK, Pool TN, Sugianto D, Wulur H. Gallbladder wall thickening in dengue hemorrhagic fever: an ultrasonographic study. J Clin Ultrasound 1995; 23: 357-362. PMID: 7673451; DOI: 10.1002/jcu.1870230605
- Di Nicolò P, Tavazzi G, Nannoni L, Corradi F. Inferior Vena Cava Ultrasonography for Volume Status Evaluation: An Intriguing Promise Never Fulfilled. J Clin Med 2023; 12: 2217. PMID: 36983218; DOI: 10.3390/jcm12062217
- Airapetian N, Maizel J, Alyamani O, Mahjoub Y, Lorne E, Levrard M, Ammenouche N, Seydi A, Tinturier F, Lobjoie E, Dupont H, Slama M. Does inferior vena cava respiratory variability predict fluid responsiveness in spontaneously breathing patients? Crit Care 2015; 19: 400. PMID: 26563768; DOI: 10.1186/s13054-015-1100-9
- Porter TR, Shillcutt SK, Adams MS, Desjardins G, Glas KE, Olson JJ, Troughton RW. Guidelines for the use of echocardiography as a monitor for therapeutic intervention in adults: a report from the American Society of Echocardiography. J Am Soc Echocardiogr 2015; 28: 40-56. PMID: 25559474; DOI: 10.1016/j.echo.2014.09.009
- Yildizdas D, Aslan N. Ultrasonographic inferior vena cava collapsibility and distensibility indices for detecting the volume status of critically ill pediatric patients. J Ultrason 2020; 20: e205-e209. PMID: 33365158; DOI: 10.15557/JoU.2020.0034
- Lujan Varas J, Martinez Díaz C, Blancas R, Martinez Gonzalez O, Llorente Ruiz B, Molina Montero R, Arenillas Juanas C, Pardo A, Alcázar Sánchez-elvira L, Cambronero Galache J. Inferior vena cava distensibility index predicting fluid responsiveness in ventilated patients. Intensive Care Med Exp 2015; 3: A600. DOI: 10.1186/2197-425x-3-s1-a600
- Malbrain MLNG, Van Regenmortel N, Saugel B, De Tavernier B, Van Gaal PJ, Joannes-Boyau O, Teboul JL, Rice TW, Mythen M, Monnet X. Principles of fluid management and stewardship in septic shock: it is time to consider the four D's and the four phases of fluid therapy. Ann Intensive Care 2018; 8: 66. PMID: 29789983; DOI: 10.1186/s13613-018-0402-x
- Shams P, Goyal A, Makaryus AN. Left Ventricular Ejection Fraction. 2025 Jun 14. In: StatPearls [Internet]. Treasure Island (FL): StatPearls Publishing; 2025 Jan-. PMID: 29083812
- Potter E, Marwick TH. Assessment of Left Ventricular Function by Echocardiography: The Case for Routinely Adding Global Longitudinal Strain to Ejection Fraction. JACC Cardiovasc Imaging 2018; 11: 260-274. PMID: 29413646; DOI: 10.1016/j.jcmg.2017.11.017
- Nerella S, Sarkar UK, Namdeo H. Electrocardiographic and echocardiographic findings in children with dengue infection. J Family Med Prim Care 2022; 11: 2334-2339. PMID: 36119231; DOI: 10.4103/jfmpc.jfmpc_1280_21
- Kamaruzaman H. CPG Management of Dengue Infection in Adults (3rd Edition). Putrajaya, Malaysia: MaHTAS, 2015.
- Salahuddin M, Khalid R, Hanif S, Naeem F, Aijaz R, Ali AS. Excessive fluid resuscitation is associated with intensive care unit mortality in Pakistani patients with dengue shock syndrome. Acute Crit Care 2025; 40: 235-243. PMID: 40405510; DOI: 10.4266/acc.004008
- Thanachartwet V, Wattanathum A, Sahassananda D, Wacharasint P, Chamnanchanunt S, Khine Kyaw E, Jittmittraphap A, Naksomphun M, Surabotsophon M, Desakorn V. Dynamic Measurement of Hemodynamic Parameters and Cardiac Preload in Adults with Dengue: A Prospective Observational Study. PLoS One 2016; 11: e0156135. PMID: 27196051; DOI: 10.1371/journal.pone.0156135
- Dung NM, Day NP, Tam DT, Loan HT, Chau HT, Minh LN, Diet TV, Bethell DB, Kneen R, Hien TT, White NJ, Farrar JJ. Fluid replacement in dengue shock syndrome: a randomized, double-blind comparison of four intravenous-fluid regimens. Clin Infect Dis 1999; 29: 787-794. PMID: 10589889; DOI: 10.1086/520435
- Ngo NT, Cao XT, Kneen R, Wills B, Nguyen VM, Nguyen TQ, Chu VT, Nguyen TT, Simpson JA, Solomon T, White NJ, Farrar J. Acute management of dengue shock syndrome: a randomized double-blind comparison of 4 intravenous fluid regimens in the first hour. Clin Infect Dis 2001; 32: 204-213. PMID: 11170909; DOI: 10.1086/318479
- Chan CY, Ooi EE. Dengue: an update on treatment options. Future Microbiol 2015; 10: 2017-2031. PMID: 26594048; DOI: 10.2217/fmb.15.105
- Mansanguan C, Hanboonkunupakarn B, Muangnoicharoen S, Huntrup A, Poolcharoen A, Mansanguan S, Piyaphanee W, Phumratanaprapin W. Cardiac evaluation in adults with dengue virus infection by serial echocardiography. BMC Infect Dis 2021; 21: 940. PMID: 34507547; DOI: 10.1186/s12879-021-06639-x
- Jadav N, Vaghela N, Verma N, Davis D, Sonani AA, Patoliya P. Unmasking the Hidden Threat of Cardiac Involvement in Dengue Fever: A Critical Longitudinal Study. Cureus 2023; 15: e45961. PMID: 37900359; DOI: 10.7759/cureus.45961
- Chin WV, Ngai MMI, See KC. Venous excess ultrasound: A mini-review and practical guide for its application in critically ill patients. World J Crit Care Med 2025; 14: 101708. PMID: 40491888; DOI: 10.5492/wjccm.v14.i2.101708
- Assavapokee T, Rola P, Assavapokee N, Koratala A. Decoding VExUS: a practical guide for excelling in point-of-care ultrasound assessment of venous congestion. Ultrasound J 2024; 16: 48. PMID: 39560910; DOI: 10.1186/s13089-024-00396-z
- Chin WV, Khaw MJ. Dengue Cardiomyopathy Treatment Strategy Optimisation by Integrating Point of Care Ultrasound (POCUS) with VExUS. POCUS J 2024; 9: 42-45. PMID: 39634694; DOI: 10.24908/pocus.v9i2.17706